


「雅思寫作 Task 1 餅圖該怎麼寫才能拿到高分?」這是許多考生在準備雅思考試時最迫切想知道的問題。答案其實比你想像的更具體: 雅思小作文餅圖的高分關鍵在於精準識別主要特徵、採用清晰的四段結構,以及運用多樣化的比較句型與詞彙。然而,多數考生往往陷入「數據羅列陷阱」,誤以為將圖表中的所有數字逐一描述就能獲得理想分數,結果卻因缺乏邏輯分組和有效比較而止步於 Band 6 以下。
真正讓考官眼前一亮的餅圖寫作需要從學術報告的角度出發,而非單純的數字翻譯。當你能夠在兩分鐘內完成同義改寫開篇、用兩句話總結圖表核心特徵、按邏輯將數據分組比較,並運用「account for」以外的至少五種佔比動詞時,你就已經踏上了通往 Band 8+ 的正軌。這不僅是語言能力的展現,更是分析思維的體現。
IELTSTongXue 深入研究雅思官方評分準則多年,發現餅圖寫作存在明確的得分公式。這篇終極指南將為你拆解從 Overview 撰寫到詞彙升級的每個環節,提供五個真實範例的逐句分析,並解答最常見的進階疑問。無論你目前在哪個分數段,這份系統化攻略都將幫助你建立穩定的高分寫作本能,讓餅圖不再是你的弱項,而是展現實力的最佳機會。
I. 從雅思官方標準解構 IELTS Writing Task 1 Pie Chart 核心
理解官方評分標準是寫好雅思小作文餅圖的第一步。許多考生誤以為 IELTS Writing Task 1 考查的是文學性寫作,實際上它評估的是你以學術報告形式呈現數據的能力。雅思官方評分準則建立在四個核心標準之上:任務完成度、連貫與銜接、詞彙資源,以及語法廣度與準確性。這些標準並非孤立存在,而是相互關聯、共同構成一篇高分文章的基石。
許多低分文章的共同問題在於單純羅列數據,缺乏有效的比較與總結。相對地,高分文章能夠識別圖表中的主要特徵,進行邏輯分組,並使用精確的語言描述數據關係。從描述到分析的轉變,正是 Band 6 IELTS 與 Band 8+ IELTS 之間的關鍵差異。當你開始思考「這些數據告訴我們什麼趨勢或對比」而非「我該如何列出所有數字」時,你就已經踏上了高分之路。
1. 任務完成度 (Task Achievement)
任務完成度評估你是否完整回應了題目要求,這個標準的核心在於 Overview 段落的撰寫品質。Overview 必須清楚指出圖表中最顯著的特徵,而非重複細節數據。主要特徵的判斷標準包括:最大值與最小值的識別、明顯的趨勢或變化,以及值得注意的對比或相似之處。
舉例來說,若一個餅圖顯示能源消耗比例,最大的板塊佔據 45% 而最小的僅有 3%,這個極值對比就是主要特徵。Band 8+ 的文章會在 Overview 中明確指出「Oil dominates energy consumption, while solar energy accounts for a negligible proportion.」, 而非在主體段落才提及這個關鍵資訊。記住, 考官首先查看的就是你是否能夠識別並呈現這些關鍵特徵。
2. 連貫與銜接 (Coherence and Cohesion)
連貫與銜接評估你的文章結構是否清晰,段落之間的連接是否自然流暢。四段結構是雅思小作文 Pie chart 的黃金標準:開篇改寫、總體概述、兩個主體段落。這個結構確保了資訊的邏輯呈現,避免讀者在數據海洋中迷失方向。
高級連接詞的使用能夠顯著提升文章的連貫性。在描述對比時,可以使用「In contrast」、「whereas」或「while」;表達相似性時,選用「similarly」、「likewise」或「in the same vein」;呈現補充資訊時,「furthermore」、「additionally」或「moreover」都是理想選擇。然而,過度使用連接詞會讓文章顯得僵硬,關鍵在於自然地引導讀者從一個觀點過渡到下一個觀點。
3. 詞彙資源 (Lexical Resource)
詞彙資源考查你使用精準且多樣化詞彙的能力,特別是描述數據時的專屬詞彙。重複使用相同詞彙會嚴重影響分數,因此掌握同義詞替換至關重要。描述「佔比」時,你可以交替使用「account for」、「constitute」、「represent」、「make up」或「comprise」。
精確的形容詞和動詞能夠提升表達的專業度。與其說「big part」,不如使用「substantial proportion」或「considerable share」;替代「small part」,可以選擇「negligible portion」或「marginal segment」。動詞的選擇同樣重要,「dominate」、「lead」、「surpass」等詞彙能夠生動描繪數據之間的關係,展現你對語言的掌控能力。
4. 語法廣度與準確性 (Grammatical Range and Accuracy)
語法廣度與準確性評估你運用複雜句型的能力以及語法的正確性。在 IELTS Writing Task 1 Pie chart 中,比較級句型是展現語法廣度的有效工具,例如「Oil consumption was three times higher than that of solar energy」或「Natural gas accounted for twice as much as renewable sources」。
被動語態在學術報告中扮演重要角色,它能夠將焦點放在數據本身而非行為者上。「The largest proportion was occupied by industrial use」比「Industrial use occupied the largest proportion」更符合學術寫作的客觀性。狀語從句也是高分文章的標誌,「While renewable energy represented only 12% in 2010, this figure rose dramatically to 35% by 2020」這類句子同時展現了複雜結構和精確的數據描述能力。
為了更深入理解雅思寫作的評分標準,建議你參考 IELTSTongXue 的文章《雅思寫作分數:從官方標準到 9 分的終極指南》!
II. 四步拆解雅思小作文餅圖滿分結構
理解了評分標準後,我們需要將理論轉化為可執行的寫作流程。一篇 Band 8+ 的餅圖文章遵循清晰的四步結構:精準開篇、靈魂概述、邏輯分組、語言升級。這個流程不僅確保你完成所有任務要求,更重要的是,它能夠引導你有條不紊地組織資訊,展現出色的學術報告能力。每一步都對應著特定的評分標準,掌握這個流程就等於掌握了高分的密碼。
1. 第一步: 精準開篇 (Introduction) – 2分鐘內掌握同義改寫的藝術
開篇段落的目標是用自己的語言改寫題目描述,這看似簡單卻是展現詞彙能力的第一個機會。同義詞替換是核心技巧,但切記不要改變原意。若題目使用「shows」,你可以替換為「illustrates」、「depicts」、「presents」或「compares」;「percentage」可以改為「proportion」、「share」或「distribution」。
句型結構的調整同樣重要。原題若為「The pie chart shows the percentage of household expenditure in 2020」,你可以改寫為「The pie chart illustrates how household spending was distributed across different categories in 2020」或「Presented in the pie chart is the breakdown of household expenditure by category for the year 2020」。這種改寫不僅避免了抄襲,更展現了你靈活運用語言的能力。
| 原詞/句 | 高分替換詞/句 |
| shows | illustrates / depicts / presents / compares |
| percentage | proportion / share / distribution / breakdown |
| The chart shows… | The chart illustrates how… / Presented in the chart is… |
| different types of | various categories of / several kinds of |
| in 2020 | for the year 2020 / during 2020 |
2. 第二步: 撰寫靈魂概述 (Overview) – 兩大黃金法則,鎖定核心特徵
Overview 是整篇文章的靈魂,它決定了你的任務完成度分數。許多考生忽略這個段落或將其與細節描述混淆,這是致命錯誤。Overview 必須獨立成段,放置在開篇之後,用兩到三句話總結圖表的主要特徵,絕不包含具體數據。
- 第一個黃金法則是極值識別: 找出最大值和最小值,並在 Overview 中明確指出。
- 第二個法則是趨勢或對比識別觀察數據之間是否存在明顯的差異、相似性或分組模式。例如,若三個類別的數據相近,而其他類別明顯較小,這種分組對比就是主要特徵。
以下是三個萬用概述句型模板,你可以根據實際圖表填入相應資訊:
- 「Overall, it is clear that [最大類別] dominated the [總體主題], while [最小類別] represented only a negligible proportion」;
- 「At first glance, [主要觀察] stands out as the most striking feature, with [次要觀察] also worthy of note」;
- 「In general, the data reveals a clear division between [一組類別] and [另一組類別], with the former accounting for the majority」。
3. 第三步: 邏輯分組 (Body Paragraphs) – 三種分段策略,讓細節井然有序
主體段落的核心任務是有邏輯地呈現細節數據,而非隨意羅列數字。三種實用的分組策略能夠幫助你組織資訊:按數值大小分組、按類別性質分組,以及按時間對比分組(針對多個餅圖)。選擇哪種策略取決於圖表的特性和數據的分布情況。
按數值大小分組是最常見的策略,適用於數據差異明顯的情況。第一個主體段落描述佔比最高的兩到三個類別,第二個段落處理剩餘的較小類別。寫作框架可以是:「The largest share of [主題] was attributed to [類別A], accounting for [數據]. This was closely followed by [類別B], which represented [數據]」,然後在第二段:「In contrast, the remaining categories constituted a much smaller proportion. [類別C] made up [數據], while [類別D] and [類別E] combined accounted for merely [數據]」。
按類別性質分組適合數據具有明顯分類特徵的情況,例如將「傳統能源」和「可再生能源」分開描述,或將「必需品消費」與「非必需品消費」分段呈現。這種策略的優勢在於它不僅呈現數據,更揭示數據背後的邏輯關係。按時間對比分組則專門針對比較不同時期的多個餅圖,每個段落分別描述一個時期的特徵,然後在段落間或段落內進行對比。
4. 第四步: 詞彙與句型升級 – 從 Band 6 到 Band 8+ 的語言寶庫
語言的精確度和多樣性是區分 Band 6 和 Band 8+ 的關鍵因素。這個階段需要建立你的專屬詞彙庫,涵蓋描述佔比、表達數值、進行比較的所有核心詞彙和句型。掌握這些語言工具後,你將能夠以多種方式表達相同的概念,避免重複,展現語言掌控力。以下三個表格為你系統整理了餅圖寫作中最實用的語言資源,每個表格都配有具體例句,幫助你理解雅思詞彙在真實語境中的應用方式。
語言升級策略 1: 描述「佔比」的核心動詞庫
描述佔比時,動詞的選擇直接影響表達的專業度。下表整理了七個核心動詞及其用法,這些動詞能夠讓你在整篇文章中避免重複使用相同詞彙,同時展現你對英語搭配的精確掌握。每個動詞都有其獨特的語感和使用情境,熟練掌握它們能夠讓你的寫作更加自然流暢。
| 核心動詞 | 語法搭配 | 實例句型 | 使用情境 |
| Account for | account for + 百分比/分數 | Manufacturing accounted for 35% of total employment. | 最常用的中性表達,適用於所有情況 |
| Constitute | constitute + 名詞片語 | Services constituted the largest sector in the economy. | 較正式,強調組成或構成關係 |
| Represent | represent + 百分比/ 分數 | Retail represented one-fifth of consumer spending. | 中性表達,可與 account for 交替使用 |
| Make up | make up + 百分比/ 分數 | Small businesses made up 28% of the local market. | 略微非正式但完全可接受,增加表達變化 |
| Comprise | comprise + 百分比/ 分數 | Domestic consumption comprised over half of GDP. | 正式表達,注意無需使用被動語態 |
| Occupy | occupy + 名詞(位置/ 份額) | Technology occupied the dominant position with 42%. | 強調佔據或佔領的概念,適合描述主導地位 |
| Hold | hold + 名詞(份額/ 比例) | Agriculture held a mere 7% share of national output. | 強調持有或保持,常與 small/ large share 搭配 |
語言升級策略 2: 表達「分數與百分比」的多樣化詞彙
將百分比轉換為分數詞彙或使用模糊表達能夠豐富你的語言風格,避免文章充斥過多數字。這個技巧不僅展現詞彙廣度,更能讓文章讀起來更加自然流暢。下表提供了常見百分比的精確分數表達,以及各種程度的模糊表達方式,讓你能夠根據實際數據靈活選擇最合適的表達形式。
| 百分比數值 | 精確分數表達 | 模糊表達(適用範圍) | 完整例句 |
| 25% | a quarter/ one-fourth | approximately a quarter (23-27%) | Transportation accounted for roughly a quarter of emissions. |
| 33% | a third/ one-third | approximately one-third (30-35%) | Healthcare represented nearly a third of government expenditure. |
| 50% | half/ one-half | around half (48-52%) | Renewable sources made up just over half of energy production. |
| 66% | two-thirds | approximately two-thirds (64-68%) | Urban areas consumed roughly two-thirds of total resources. |
| 75% | three-quarters | nearly three-quarters (73-77%) | Manufacturing occupied almost three-quarters of industrial output. |
| 10-15% | – | a small proportion/ a minor share | Education held a relatively small proportion at 12%. |
| 40-45% | – | a substantial proportion/ a considerable share | Services constituted a substantial proportion of the economy at 43%. |
| 5% 以下 | – | a negligible portion/ a marginal segment | Traditional methods represented merely a negligible portion at 3%. |
使用這些表達時需要注意準確性,「approximately」和「roughly」表示誤差在正負2-3%範圍內,「nearly」和「almost」則暗示略低於該數值,「just over」和「slightly above」表示略高於該數值。選擇正確的模糊表達能夠展現你對英語細微差別的敏感度。
語言升級策略 3: 進行「比較與對比」的高級句型
比較與對比是餅圖寫作的核心技能,高分文章必須展現多樣化的比較句型結構。下表整理了五種主要的比較類型及其對應的高級句型,從倍數比較到程度對比,從簡單比較到複雜的讓步對比,這些句型能夠幫助你精準表達數據之間的關係,同時展現語法廣度與準確性。
| 比較類型 | 句型結構 | 實例句型 | 語法要點 |
| 倍數比較 | A + be動詞 + 倍數 + as large/ high as + B | Category A was twice as large as Category B, accounting for 40% compared to 20%. | 倍數詞包括 twice, three times, four times 等,注意使用 as…as 結構 |
| 倍數比較 | The proportion of A + be動詞 + 倍數 + higher/ larger than that of B | The share of industrial use was three times higher than that of residential use. | 使用 that/those 指代前面的名詞,避免重複 |
| 對比連接 | While/ Whereas + 句子A, 句子B | While urban areas consumed 60% of resources, rural regions accounted for only 40%. | While 和 whereas 可互換,放句首時後接逗號 |
| 對比連接 | 句子A, whereas/ while + 句子B | Manufacturing dominated in Country A, whereas services led in Country B. | 放句中時前面使用逗號,連接兩個獨立句子 |
| 程度比較 | significantly/ considerably/ marginally + 比較級 + than | Renewable energy represented a significantly smaller share than fossil fuels at 15% versus 65%. | 副詞修飾比較級,表達差異程度 |
| 極端對比 | In stark/ sharp contrast to A, B + 動詞 | In stark contrast to the 2010 figures, the 2020 data revealed a complete reversal of priorities. | 強烈對比,適合描述巨大差異或反向趨勢 |
| 讓步對比 | Although/ Though + 句子A, 句子B | Although oil remained the largest source at 35%, its dominance had weakened considerably from the previous 52%. | 讓步從句承認一個事實,主句提出對比或轉折 |
掌握這些句型後,你需要在實際寫作中靈活運用,避免機械套用。理想的做法是在一篇文章中使用三到四種不同的比較句型,既展現語法多樣性,又保持表達的自然流暢。記住,這些句型不是孤立的工具,而是幫助你精確傳達數據關係的語言橋樑,當你能夠根據數據特點選擇最合適的句型時,你就已經達到了 Band 8+ 的語言掌控水平。
看更多文章:
III. 雅思小作文餅圖範例 7.0+
實戰範例能夠將所有理論知識具體化,讓你看到高分文章的真實樣貌。以下五個範例涵蓋了不同類型的餅圖題目,從單一餅圖到多圖比較,從簡單分類到複雜數據。每個範例都包含題目、Band 7.0+ 範文,以及詳細的寫作分析,幫助你理解每個高分要素的應用方式。
1. 雅思小作文餅圖: Comparison of Energy Production
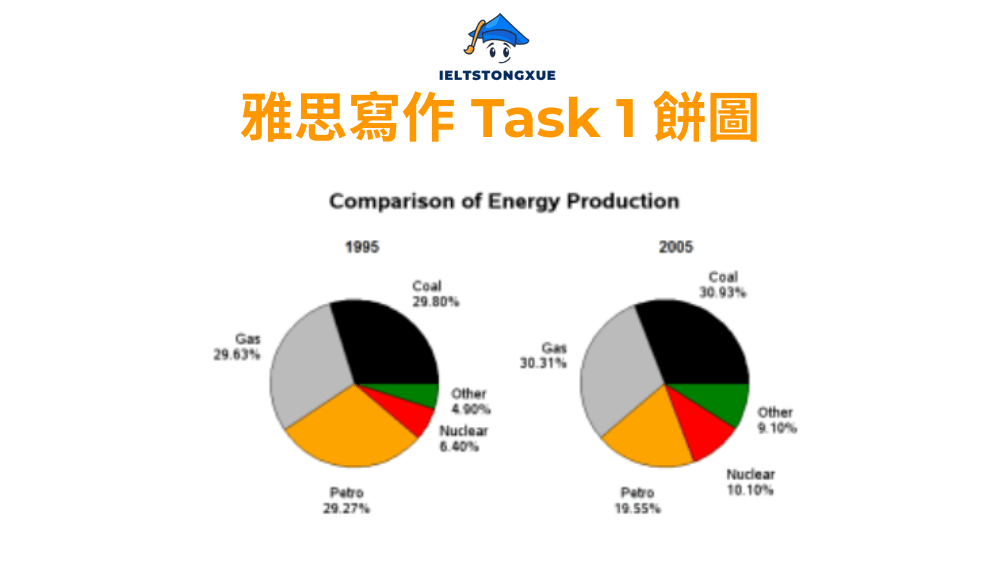
題目: The pie charts compare the proportion of energy produced from different sources in a country in 1985 and 2003.
雅思小作文餅圖範文:
The pie charts illustrate how the distribution of energy production across various sources changed in a particular country between 1985 and 2003.
Overall, it is evident that oil remained the dominant energy source throughout the period, though its share declined. Nuclear power experienced the most dramatic growth, while other renewable energy showed a substantial increase by 2003.
In 1985, oil accounted for just over half of total energy production at 52%, making it by far the largest contributor. Nuclear power represented only 8% at this time, while natural gas and coal held similar proportions at 13% and 8% respectively. Other renewable sources constituted a mere 1% of energy production.
By 2003, the energy landscape had shifted considerably. Although oil’s dominance persisted, its share had decreased to 39%. Nuclear power had surged dramatically to become the second-largest source at 22%, nearly tripling its 1985 proportion. Coal’s contribution rose marginally to 13%, while natural gas saw a slight increase to 23%. Most notably, other renewable energy expanded significantly to 4%, quadrupling its previous share.
寫作分析: 這篇範文展現了多個Band 8 特徵。開篇使用「illustrate how the distribution changed」替代題目的「compare the proportion」,展現同義改寫能力。Overview 清楚指出兩個主要特徵:油的持續主導地位及其份額下降,以及核能的顯著增長。主體段落按時間分組,第一段描述1985年,第二段描述2003年並進行對比。詞彙方面,「surged dramatically」、「expanded significantly」等短語精準描述變化程度,「by far the largest」、「a mere 1%」等表達展現詞彙範圍。語法上,複雜比較句型「nearly tripling its 1985 proportion」和「quadrupling its previous share」展現了高級語法能力。
2. 雅思小作文餅圖: Time spent on smartphones and tablets, by category
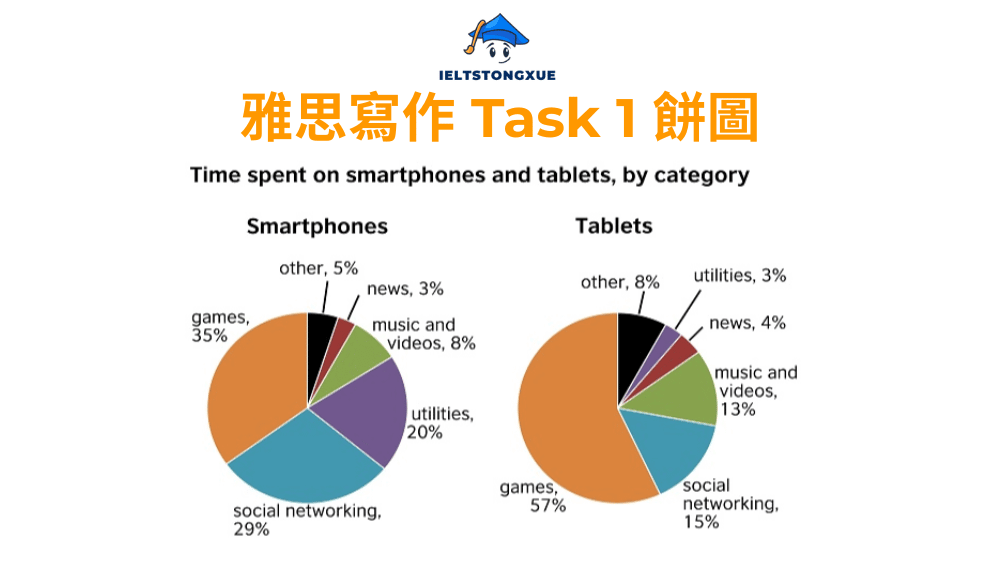
題目: The pie chart shows the proportion of time people spent on smartphones and tablets for different activities in 2019.
雅思小作文餅圖範文:
The pie chart depicts the breakdown of time allocation across various activities on smartphones and tablets during 2019.
At first glance, it is clear that entertainment-related activities dominated device usage, with gaming and social media collectively accounting for the majority of time spent. In contrast, productive activities such as work and education represented a relatively minor share.
Gaming emerged as the single largest category, consuming 35% of total usage time. Social media followed closely, making up 29% of the time spent on these devices. Together, these two entertainment-focused activities comprised nearly two-thirds of all device usage, highlighting their central role in how people engaged with mobile technology.
The remaining categories showed considerably lower proportions. Utility functions accounted for 15% of usage time, while news and information represented 9%. Work-related activities and education occupied the smallest shares at 8% and 4% respectively, indicating that despite the versatility of modern devices, their primary function remained entertainment rather than productivity.
寫作分析: 此範文的Overview精準識別主要特徵:娛樂活動的主導地位與生產性活動的次要地位。主體段落採用按數值大小分組策略,第一段聚焦最大的兩個類別,第二段處理剩餘較小類別。詞彙選擇展現多樣性:「consuming」、「making up」、「comprised」、「accounted for」、「occupied」都用於描述佔比,避免重複。「emerged as」、「followed closely」等短語自然連接資訊。語法上,「highlighting their central role」使用分詞結構增加句子複雜度,「indicating that」引導結果狀語從句,展現語法廣度。
3. 雅思小作文餅圖: Proportion of Carbohydrates, Protein and Fat in Diets
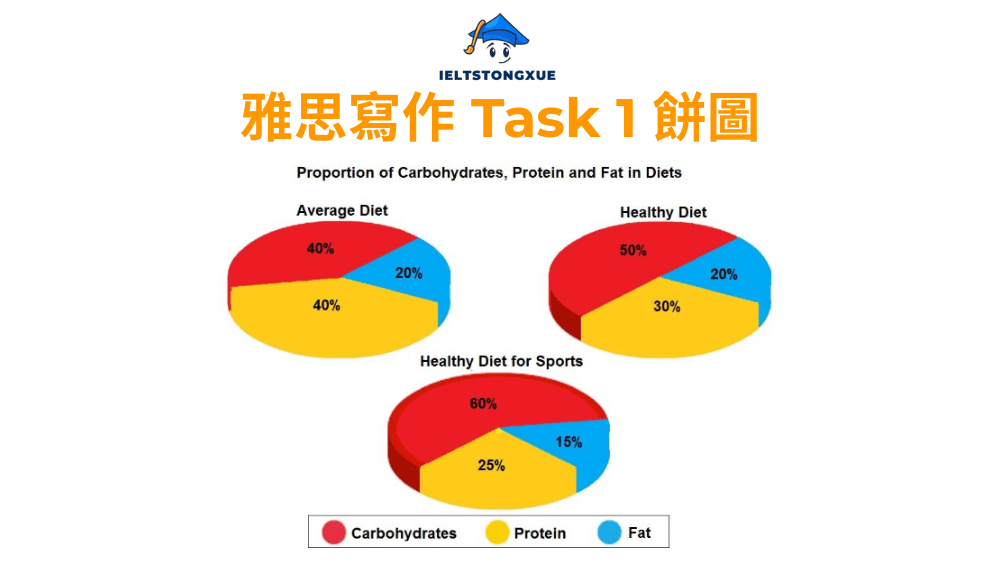
題目: The pie charts show the proportion of carbohydrates, protein and fat in three different diets: a healthy diet, a healthy diet for sport, and an average diet.
雅思小作文餅圖範文:
The pie charts compare the nutritional composition of three distinct diets, specifically illustrating the distribution of carbohydrates, protein, and fat in a healthy diet, a sports-oriented healthy diet, and an average diet.
Overall, carbohydrates form the largest component in all three diets, though their proportion varies significantly. The sports diet contains the highest carbohydrate percentage, while protein levels remain relatively consistent across all dietary patterns.
In the healthy diet, carbohydrates constitute 60% of nutritional intake, with fat and protein accounting for 25% and 15% respectively. The sports-focused healthy diet shows a notable shift, with carbohydrates increasing to 65% to meet higher energy demands. Fat decreases marginally to 20%, while protein holds steady at 15%, reflecting the sustained importance of muscle maintenance in athletic nutrition.
The average diet presents a markedly different pattern. Carbohydrates drop to 50%, representing a substantially lower proportion than in either healthy diet variant. Fat increases significantly to 35%, making it the second-largest component and highlighting potential nutritional imbalances. Protein remains unchanged at 15%, suggesting this macronutrient maintains a stable role regardless of overall dietary quality.
寫作分析: 這個三餅圖範例展現了更複雜的比較技巧。Overview成功識別兩個關鍵趨勢:碳水化合物在所有飲食中的主導地位,以及蛋白質的相對穩定性。主體段落採用混合策略,按飲食類型分組同時進行橫向比較。第一段描述健康飲食和運動飲食,第二段聚焦一般飲食並與前兩者對比。連接詞使用自然:「while」、「though」、「whereas」引導對比,「reflecting」和「suggesting」連接觀察與解釋。詞彙精準度高:「constitute」、「accounting for」、「holds steady」、「remains unchanged」展現描述靜態數據的多樣方式,「increases significantly」、「drop to」、「decreases marginally」精確描述變化。
4. 雅思小作文餅圖: How happy are you with the IT support offered?
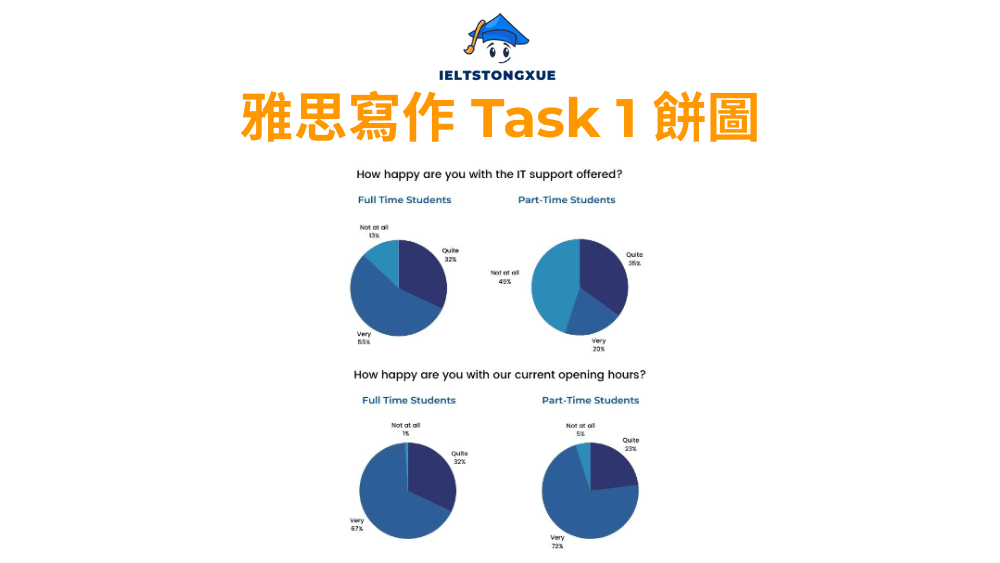
題目: The pie charts show the results of a survey conducted by a university library asking full-time and part-time students about their satisfaction with IT support services.
雅思小作文餅圖範文:
The pie charts illustrate the satisfaction levels of full-time and part-time students regarding IT support services provided by a university library, based on survey responses.
Overall, both student groups demonstrated predominantly positive attitudes toward IT support, with satisfaction levels outweighing dissatisfaction. However, full-time students expressed notably higher contentment than their part-time counterparts.
Among full-time students, the majority reported being either very happy or quite happy with IT support, collectively representing 85% of respondents. Specifically, 55% indicated they were very happy, while 30% stated they were quite happy. Only 10% expressed dissatisfaction by choosing “not happy,” and a mere 5% remained neutral, selecting “don’t know.”
Part-time students showed a somewhat different pattern, though overall satisfaction remained strong. The proportion of very happy students decreased to 38%, while quite happy students accounted for 42%, bringing total satisfaction to 80%. Dissatisfaction was more pronounced in this group, with 15% reporting they were not happy. The neutral response rate remained minimal at 5%, identical to full-time students.
寫作分析: 此範文展現了處理調查數據的專業方式。Overview不僅指出總體滿意度高,更識別出兩組學生之間的差異,這是關鍵特徵。主體段落按學生類型分組,每段內部按滿意度等級從高到低排列,邏輯清晰。詞彙方面,「demonstrated」、「expressed」、「indicated」、「stated」等動詞避免重複使用「showed」,「predominantly positive」、「notably higher contentment」等短語展現精確表達能力。語法上,「bringing total satisfaction to 80%」使用分詞短語總結數據,「though overall satisfaction remained strong」用讓步狀語從句平衡對比,展現複雜句型能力。數據整合技巧(如將「very happy」和「quite happy」合併為「total satisfaction」)展現了高級的數據處理能力。
5. 雅思小作文餅圖: Average percentage of sodium, saturated fats and added sugars in typical meals consumed in the USA
題目: The pie charts show the average percentage of sodium, saturated fats, and added sugars in typical meals consumed in the USA.

雅思小作文餅圖範文:
The pie charts depict the distribution of sodium, saturated fats, and added sugars across four typical daily meals—breakfast, lunch, dinner, and snacks—consumed in the USA.
Overall, dinner emerges as the primary source of sodium and saturated fats, while snacks contribute the highest proportion of added sugars. Breakfast consistently represents the smallest share across all three nutritional components.
Regarding sodium intake, dinner accounts for the largest portion at 43%, followed by lunch at 29%. Snacks constitute 14% of sodium consumption, while breakfast represents merely 14%, making it the least significant contributor to daily sodium levels.
The distribution of saturated fats follows a similar pattern, with dinner dominating at 37% and lunch contributing 26%. Snacks make up 21% of saturated fat intake, whereas breakfast again occupies the smallest share at 16%.
In contrast, the added sugars distribution reveals a markedly different trend. Snacks emerge as the leading source at 42%, significantly surpassing dinner’s 23% and lunch’s 19%. Breakfast shows the lowest contribution at 16%, maintaining its position as the least significant meal across all three nutritional categories.
寫作分析: 這個複雜的多餅圖範例展現了高級組織技巧。Overview巧妙總結三個圖表的共同點(晚餐在鈉和脂肪方面的主導地位、零食在糖分方面的領先、早餐的一致性低比例),這需要對數據的深刻理解。主體段落按營養成分分組,每段描述一種成分在四餐中的分布,這種策略比按餐次分組更有效,因為它便於讀者比較相同成分的模式。連接詞使用精準:「Regarding」、「In contrast」明確標示主題轉換,「while」、「whereas」引導對比。詞彙多樣性突出:「accounts for」、「contribute」、「constitute」、「make up」、「represents」、「occupies」交替使用,「emerges as」、「dominating at」、「surpassing」展現動態描述能力。語法複雜度高:「making it the least significant contributor」、「maintaining its position as」等分詞結構增加句子層次,「reveals a markedly different trend」展現主題句的引導作用。
IV. 雅思小作文餅圖的常見問題(FAQ)
掌握基礎知識和實戰技巧後,你可能仍有一些深層疑問。這個部分專門解答那些經常困擾考生的進階問題,幫助你突破學習瓶頸,達到更高水平。這些問題涵蓋結構選擇、特徵識別、分組技巧以及與其他圖表類型的比較,為你提供更全面的理解視角。
1. 餅圖文章可以超過四段嗎?
四段結構(開篇、概述、兩個主體段落)是雅思小作文餅圖的最佳選擇,但並非絕對規則。在數據極其複雜或有三個以上餅圖需要比較時,你可以使用五段結構,將主體內容分為三段。然而,多數情況下四段已經足夠,這個結構的優勢在於邏輯清晰、易於控制字數,並且符合考官的閱讀期待。過多段落可能導致結構鬆散,每段資訊量不足,反而影響連貫性分數。記住,品質永遠比數量重要,與其追求更多段落,不如確保每段都有明確主題和充實內容。
2. 何謂考官眼中的「主要特徵 (Key Features)」?
主要特徵是指圖表中最顯著、最值得關注的資訊模式,而非所有數據的總和。判斷標準包括三個方面:極值(最大值和最小值)、明顯差異(數據之間的巨大對比),以及整體趨勢(多個數據的共同模式或分組特徵)。若一個類別佔據 60% 而其他類別都在 10% 以下,這個主導地位就是主要特徵。若兩個類別數據相近且遠高於其他類別,這種配對模式也是主要特徵。關鍵在於問自己:「這個圖表最想告訴我什麼?」而非「我能從圖表中讀出什麼?」前者引導你找到主要特徵,後者只會讓你列舉所有細節。
3. 當數據板塊過多或過於零散時,有哪些高效的分組技巧?
面對複雜數據時,「合併同類項」和「聚焦極值」是兩個核心策略。合併同類項指將性質相似或數值接近的類別歸為一組進行描述,例如將所有小於 5% 的類別統稱為「其他次要類別,合計佔 12%」。這種方法避免逐一列舉微小數據,保持文章重點突出。聚焦極值策略則是詳細描述最大的兩到三個類別,然後用一句話概括剩餘所有小類別,如「The remaining categories, including A, B, and C, collectively accounted for less than one-fifth of the total」。這兩種技巧的本質都是「取捨」,記住你的任務是報告主要資訊,而非成為數據的複印機。
4. 與長條圖 (Bar Chart) 相比,描述餅圖時的側重點有何根本不同?
餅圖和長條圖雖然都呈現數據,但本質側重點截然不同。餅圖的核心是「比例」和「佔比」,它展現部分與整體的關係,因此你的描述應聚焦於「某類別在總體中的份額」以及「各部分之間的比例關係」。相對地,長條圖側重「數值」和「差異」,它比較絕對數量或展示趨勢變化,描述時應強調「具體數值的高低」和「數量的增減幅度」。舉例說明:對於餅圖,你會說「Education accounted for one-third of government spending」,強調佔比;對於長條圖,你會說「Government spending on education reached 300 billion, 50 billion higher than the previous year」,強調數值和變化。認清這個本質差異,你才能選擇正確的詞彙和句型,真正展現對圖表類型的理解。
結論
從官方評分標準的深度解析,到四步滿分結構的系統建立,再到實戰範例的逐句剖析,這份指南為你提供了征服雅思小作文餅圖所需的全部工具。理論知識固然重要,但真正的掌握來自持續的實踐與反思。將本文介紹的方法論應用到實際寫作中,分析自己的文章是否識別了主要特徵、是否邏輯分組、是否展現詞彙多樣性,這個過程會將知識內化為本能。記住, Band 8+ 不是遙不可及的目標,而是方法正確、練習充分的自然結果。從今天開始,每次面對餅圖時,你都不再是被動的數據描述者,而是主動的資訊分析者,用精準的語言、清晰的邏輯向考官展現你的學術報告能力,這就是通往高分的必經之路。