


您是否曾經在面對 IELTS Writing Task 1 的複雜圖表時感到無從下手,即使投入大量練習時間仍然無法突破分數瓶頸?IELTSTongXue 為您呈現這份終極寫作指南,涵蓋學術組與一般訓練組的完整攻略。
許多考生在準備雅思寫作時面臨著共同的困境:缺乏系統性的學習方法、無法準確識別圖表中的關鍵特徵、詞彙表達單調重複,以及對評分標準的模糊理解。這些問題往往導致學習效率低下,讓原本充滿希望的備考之路變得充滿挫折。更令人困擾的是,市面上的學習資源往往零散不全,缺乏從基礎概念到高階技巧的完整學習路徑,使得考生難以建立穩定可靠的寫作能力。
本指南將為您提供考官級的專業策略,包含 IELTS Writing Task 1 七大圖表題型的深度解析、三種書信語氣的完全掌握、豐富的高分詞彙庫,以及經過實戰驗證的九分範文精解。無論您目前處於哪個程度,都能在這裡找到提升寫作能力的具體方法和實用工具。現在讓我們開始這趟從困惑走向精通的學習旅程。
I. 掌握 IELTS Writing Task 1 核心規則與評分標準,奠定高分基石
就如同建造摩天大樓需要堅實地基一樣,要在 IELTS Writing Task 1 中取得理想成績,您必須先徹底理解考試的核心規則和評分機制。
1. 學術組 (A類) vs. 一般訓練組 (G類) 的根本差異 (IELTS Academic vs IELTS General Training)
選擇正確的考試類型是您踏上雅思寫作 Task 1 之路的第一步,因為兩者在任務性質、寫作目標和評估重點上存在顯著差異。下表清楚呈現兩種考試類型的核心區別:
| 比較項目 | 學術組 (Academic) | 一般訓練組 (General Training) |
| 考試任務 | 圖表數據分析與描述 | 書信寫作 |
| 寫作目標 | 客觀描述圖表趨勢與特徵 | 達成特定溝通目的 |
| 寫作風格 | 正式學術語調 | 依情境調整語氣 |
| 時間要求 | 20 分鐘 | 20 分鐘 |
| 字數要求 | 至少 150 字 | 至少 150 字 |
| 評分重點 | 數據準確性與分析邏輯 | 溝通效果與語氣適當性 |
在 IELTS Writing Task 1 中,學術組考生需要具備解讀複雜圖表的能力,而一般訓練組考生則需要熟練掌握不同情境下的溝通技巧。
2. 四大評分標準的具體要求與失分陷阱
IELTS Writing Task 1 採用四個評分維度,每個維度佔總分 25%,理解這些標準將幫助您明確努力方向。
| Task Achievement (TA) / Task Response (TR) – 任務達成度 | 這個標準評估您在 IELTS Writing Task 1 中是否完整回應題目要求,包括覆蓋所有關鍵資訊和保持適當字數。成功的作品必須展現對題目的全面理解,不遺漏任何重要細節。
|
| Coherence and Cohesion (CC) – 連貫性與銜接性 | 這個維度檢視您的文章結構是否邏輯清晰,段落之間的連接是否自然流暢。優秀的作品應該引導讀者順暢地從一個想法過渡到下一個想法。
|
| Lexical Resource (LR) – 詞彙資源 | 此標準評估您的詞彙範圍、準確性和適當性。高分作品需要展現豐富的詞彙選擇和精準的用法,避免重複使用相同表達。
|
| Grammatical Range and Accuracy (GRA) – 語法範圍與準確性 | 這個標準檢視您的句式多樣性和語法正確性。理想的作品應該結合簡單句、複合句和複雜句,展現豐富的語法掌握能力。
|
II. 所有題型通用的高分結構 —— 適用於 IELTS Writing Task 1
掌握一個穩定可靠的雅思寫作 Task 1 架構是成功的關鍵,這個框架將成為您應對任何題型的基礎工具。
1. 首段 (Introduction)
在 IELTS Writing Task 1 中,引言段的核心任務是改寫題目描述,向考官展現您對任務的理解。這個段落通常只需要一到兩句話,但必須準確反映原始資訊的本質。Task 1 雅思寫作模板句型範例:
- The [圖表類型] illustrates/demonstrates/presents…
- The given [圖表類型] provides information about…
- The data depicts/reveals/shows…
成功的引言段會改變句式結構和詞彙選擇,避免直接複製題目文字。
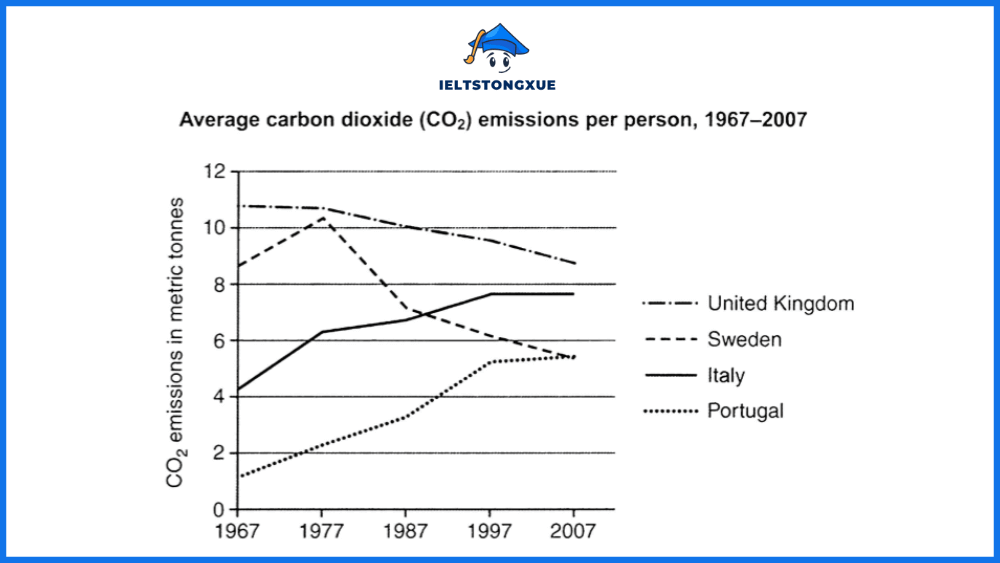
例如 IELTS Writing Task 1主題:The graph below shows average carbon dioxide (CO₂) emissions per person in the United Kingdom, Sweden, Italy and Portugal between 1967 and 2007.
示範改寫:
- The line graph illustrates the average CO₂ emissions per capita in four European countries—the United Kingdom, Sweden, Italy, and Portugal—over a 40-year period from 1967 to 2007.
- 或者 The given line graph provides information about average carbon dioxide emissions per person in four European nations over a 40-year timeframe.
- 或者 The data depicts the fluctuating patterns of carbon dioxide emissions per capita in four distinct European nations during the period between 1967 and 2007.
2. 總覽段 (Overview)
總覽段在 IELTS Writing Task 1 中扮演關鍵角色,因為它能夠展示您提取及統整主要趨勢的能力。這一部分無需包含詳細數據,而應強調最明顯的變化、最高或最低的數值,或其他整體特徵。
識別主要特徵的思考步驟:
首先掃視整個圖表,尋找最明顯的趨勢或模式 → 接著比較不同類別或時期的數據,找出最大差異 → 最後確定兩到三個最重要的觀察點,這些將構成您總覽段的骨架。
- 在地圖題中,重點關注最顯著的變化區域;
- 在流程圖中,概括整個過程的主要階段數量。
例如 IELTS Writing Task 1主題:The graph below shows average carbon dioxide (CO₂) emissions per person in the United Kingdom, Sweden, Italy and Portugal between 1967 and 2007.
示範總覽段: Overall, the data reveals two distinct patterns among these nations. While the United Kingdom and Sweden experienced peak emissions in the late 1970s followed by notable declines, Italy and Portugal demonstrated continuous upward trajectories throughout the entire period. Additionally, the United Kingdom maintained the highest emission levels for most of the timeframe, whereas Portugal consistently recorded the lowest figures.
3. 主體段 (Body Paragraphs)
在 IELTS Writing Task 1 中,主體段是您展示詳細分析能力的舞台,需要將數據進行邏輯性分組並提供具體支撐。有效的分組策略包括按時間順序、按數值大小、或按類別性質。
IELTS Writing Task 1 數據分組的邏輯範例: 在描述多條線圖時,可以將具有相似趨勢的線條歸為一組,將相反趨勢的歸為另一組。在比較不同國家數據時,可以將表現優異的國家與表現較差的國家分別討論。
記住要在描述中加入具體數字和時間點,這些細節將使您的分析更加可信和精確。同時運用比較和對比的語言技巧,突出數據之間的關係和差異。
例如 IELTS Writing Task 1主題:The graph below shows average carbon dioxide (CO₂) emissions per person in the United Kingdom, Sweden, Italy and Portugal between 1967 and 2007.
第一主體段(處理下降趨勢國家): The United Kingdom and Sweden exhibited similar emission patterns, both reaching their peaks during the late 1970s before experiencing substantial reductions. The UK’s emissions climbed from approximately 10.5 metric tonnes in 1967 to a maximum of around 11 metric tonnes in 1977, then declined steadily to roughly 9 metric tonnes by 2007. Sweden followed a parallel trajectory, starting at about 9 metric tonnes in 1967, peaking at approximately 10.5 metric tonnes in the late 1970s, and then experiencing a more dramatic decrease to approximately 5.5 metric tonnes by the end of the period.
第二主體段(處理上升趨勢國家): In contrast, both Italy and Portugal demonstrated consistent upward trends throughout the four decades. Italy’s emissions nearly doubled from around 4 metric tonnes per person in 1967 to approximately 8 metric tonnes in 2007, showing particularly rapid growth during the 1970s and 1980s before the rate of increase moderated. Portugal exhibited the most dramatic relative change, with emissions rising from merely 1.5 metric tonnes in 1967 to about 5.5 metric tonnes by 2007, representing an almost four-fold increase over the period.
這個例子清楚展示了 IELTS Writing Task 1 的典型段落結構:引言段負責設定主題背景,總覽段指出整體趨勢,而主體段則用數據來支撐分析。這樣的安排讓您的 IELTS Writing Task 1 答案同時具備整體觀察與細節說明,內容清晰、層次分明。
III. 【學術組實戰】IELTS Writing Task 1 七大圖表題型逐一擊破:策略、句型與9分範文精解
現在我們將前面建立的理論框架應用到實際圖表分析中,讓您具備處理任何學術組題型的信心和技能。
1. IELTS Writing Task 1 線圖 (Line Graph)
線圖的寫作核心在於準確描述趨勢變化和識別轉折點。成功的線圖分析需要您像數據分析師一樣思考,發現數據背後的故事和規律。
高分詞彙庫:
- 上升趨勢:surge, soar, climb, escalate, mount
- 下降趨勢:plummet, decline, decrease, drop, dip
- 平穩狀態:remain stable, plateau, level off, maintain, stabilise
- 波動變化:fluctuate, vary, oscillate, alternate
實用句型模板:
| 實用句型模板 | 例如 |
| X experienced a dramatic surge from [起點] to [終點], followed by a gradual decline to [新點位]. | Mobile phone usage among teenagers surged dramatically from 10% in 2010 to 85% in 2015, representing the most significant technological adoption of the period. |
| X + [趨勢動詞] + [副詞] + from [起始數值] + in [起始時間] + to [結束數值] + in [結束時間]. | Carbon emissions surged dramatically from 5 million tonnes in 1990 to 15 million tonnes in 2020. |
| X reached its peak/highest point of [數值] in [時間], before declining to a low of [數值] in [時間]. | Unemployment reached its peak of 12% in 2009, before declining to a low of 4% in 2019. |
| While X + [趨勢動詞] + [副詞], Y showed the opposite trend, + [相反趨勢動詞] + from [數值] to [數值]. | While renewable energy consumption increased steadily throughout the period, fossil fuel usage showed the opposite trend, declining from 80% to 45%. |
| The period can be divided into two distinct phases: + [第一階段描述] + followed by + [第二階段描述]. | The period can be divided into two distinct phases: rapid growth until 2010, followed by gradual stabilisation in subsequent years. |
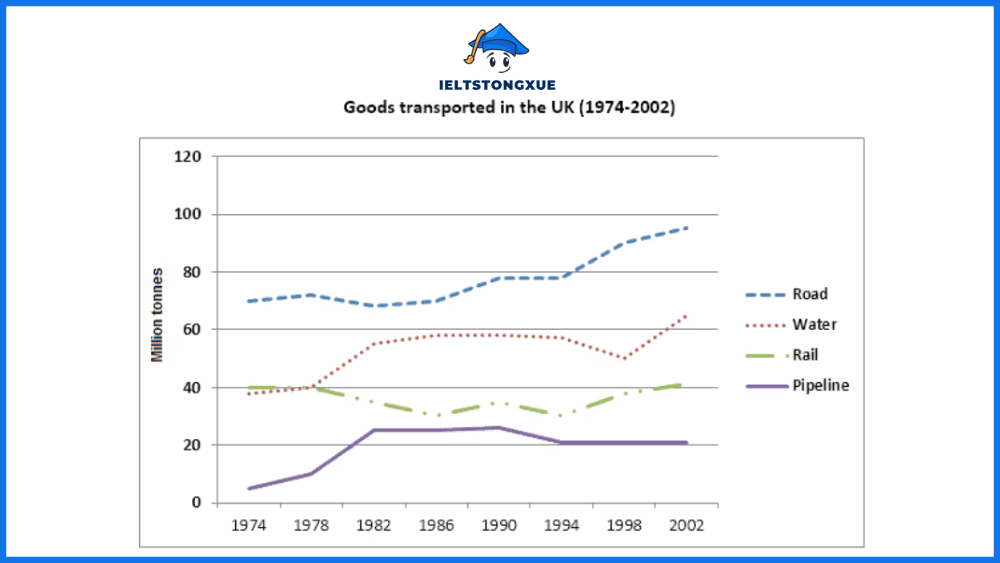
例如 IELTS Writing Task 1主題:The graph below shows the quantities of goods transported in the UK from 1974 to 2002 by four different modes of transport.
範例文章:
The line graph illustrates the quantities of goods transported in the United Kingdom by four different transportation modes over a 28-year period from 1974 to 2002.
Overall, road transport dominated goods transportation throughout the entire period, while pipeline transport remained the least utilised method. Notably, road transport experienced consistent growth, whereas rail transport showed a declining trend over the timeframe.
Road transport clearly led all categories, starting at approximately 70 million tonnes in 1974 and climbing steadily to reach nearly 100 million tonnes by 2002. This represented the most substantial increase among all transportation modes. In contrast, water transport fluctuated considerably, beginning at around 40 million tonnes, peaking at approximately 60 million tonnes in the late 1970s, before declining to roughly 50 million tonnes and then recovering to about 65 million tonnes by the end of the period.
Rail transport demonstrated a different pattern, maintaining relatively stable levels around 40 million tonnes initially, then experiencing a gradual decline to approximately 30 million tonnes by the 1990s, followed by a slight recovery. Pipeline transport showed modest but consistent growth from near zero in 1974 to approximately 22 million tonnes in 2002, representing the smallest absolute quantities but notable percentage growth.
2. IELTS Writing Task 1 長條圖 (Bar Chart) 與圓餅圖 (Pie Chart)
這兩種圖表類型的共同特點是展現比例和比較關係。您的分析重點應該放在識別最大最小值、相似數值的分組、以及顯著差異的對比上。比較表達的高級句型:
| 實用句型模板 | 例如 |
| X dominated/led the category, accounting for + [百分比/數值] + which was significantly higher than + [比較對象] + at + [數值]. | Online shopping dominated consumer spending, accounting for 45% of total retail sales, which was significantly higher than traditional stores at 25%. |
| X, Y, and Z showed remarkably similar patterns/values, with figures of + [數值範圍] + respectively, contrasting sharply with + [不同項目] + at + [數值]. | France, Germany, and Italy showed remarkably similar energy consumption patterns, with figures between 250-280 TWh respectively, contrasting sharply with Norway at 145 TWh. |
| X constituted + [比例] + of the total, while + [其他項目] + comprised + [比例] + collectively. | Healthcare constituted 35% of the national budget, while education and defence comprised 25% and 15% collectively. |
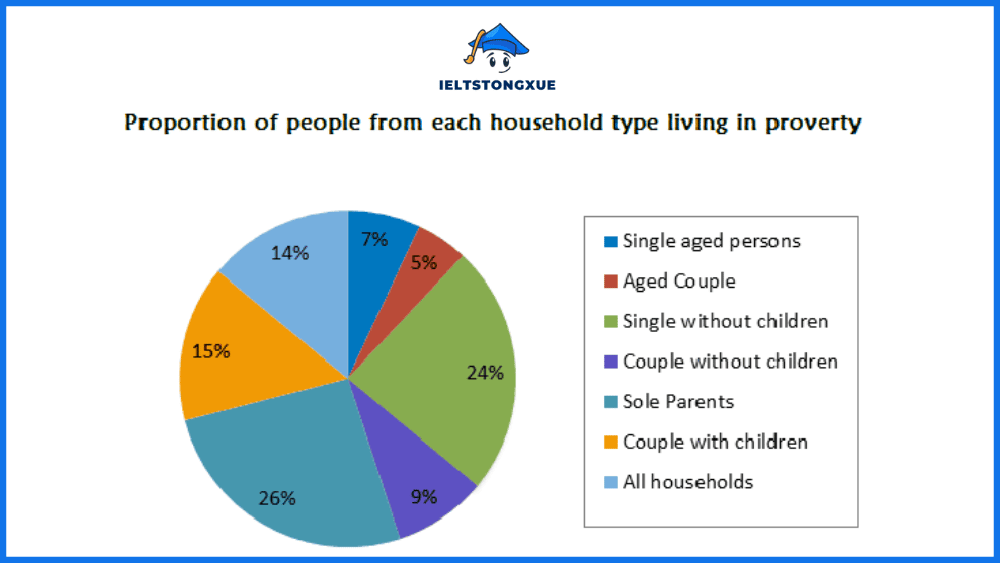
例如 IELTS Writing Task 1主題:The pie chart shows the proportion of different categories of families living in poverty in the UK in 2002. Summarize the information by selecting and reporting the main features, and make comparisons where relevant.
範例文章:
The pie chart depicts the proportion of different household types experiencing poverty in the United Kingdom in 2002.
Overall, single-parent families and couples with children constituted the largest segments of impoverished households, together accounting for over 40% of the total. Conversely, aged couples represented the smallest proportion of families living in poverty.
Single-parent households dominated the poverty statistics, comprising 26% of all impoverished families, making them the most vulnerable demographic. Couples with children followed as the second-largest group at 15%, suggesting that households with dependent children faced particular economic challenges. Single people without children accounted for 24% of the total, representing nearly a quarter of poverty-affected households.
The remaining categories showed considerably smaller proportions. Couples without children constituted 9% of impoverished households, while single aged persons represented 7% of the total. Most notably, aged couples comprised merely 5% of families experiencing poverty, indicating that this demographic enjoyed relatively greater financial security compared to other household types. The data reveals a clear pattern where households with children, particularly single-parent families, faced disproportionately higher poverty rates.
3. IELTS Writing Task 1 表格 (Table)
表格題的挑戰在於大量數據的組織和選擇。您需要發展出快速識別重要資訊的眼光,避免陷入細節的泥沼而失去整體脈絡。
數據選擇策略: 首先標記所有最高值和最低值,接著尋找明顯的模式或例外情況。在描述時,將相關數據歸類討論,而非逐行逐列地機械性描述。
高分表達技巧: 使用 “In terms of”, “Regarding”, “As for” 等片語來引導不同類別的討論,創造清晰的段落結構和邏輯流程。
| 實用句型模板 | 例如 |
| In terms of + [分類標準], + [具體描述]; regarding + [另一分類], + [具體描述]. | In terms of gender distribution, male participation dominated engineering fields at 75%; regarding age demographics, the 25-35 age group represented the largest cohort at 40%. |
| Values ranged from a minimum of + [最小值] + in + [項目] + to a maximum of + [最大值] + in + [項目], with most entries falling between + [範圍]. | Literacy rates ranged from a minimum of 65% in rural areas to a maximum of 95% in urban centres, with most regions falling between 75-85%. |
| With the notable exception of + [例外項目], all other + [類別] + exhibited + [共同特徵]. | With the notable exception of Japan, all other developed nations exhibited declining birth rates throughout the survey period. |
例如 IELTS Writing Task 1主題:The table below shows the percentages of mobile phone owners using various mobile phone features.
| Country | Food/Drinks/Tobacco | Clothing/Footwear | Leisure/Education |
| Ireland | 28.91% | 6.43% | 2.12% |
| Italy | 16.36% | 9.00% | 3.20% |
| Spain | 18.80% | 6.51% | 1.98% |
| Sweden | 15.77% | 5.40% | 3.22% |
| Turkey | 32.14% | 6.63% | 4.35% |
範例文章:
The table presents data on mobile phone feature usage across five European countries, categorised into three main functions: Food/Drinks/Tobacco, Clothing/Footwear, and Leisure/Education.
Overall, Food/Drinks/Tobacco applications dominated mobile phone usage across all nations, with Turkey showing the highest engagement and Italy demonstrating the lowest. Leisure/Education features exhibited the most variation between countries, while Clothing/Footwear usage remained consistently low throughout.
Regarding Food/Drinks/Tobacco features, Turkey led significantly with 32.14% of users engaging with these applications, followed by Ireland at 28.91%. Spain occupied a middle position at 18.80%, while Sweden and Italy showed lower adoption rates at 15.77% and 16.36% respectively. This category clearly attracted the highest user engagement across all surveyed nations.
Clothing/Footwear applications demonstrated remarkably consistent patterns, with usage rates remaining below 10% in all countries. Italy achieved the highest adoption at 9.00%, while Ireland recorded the lowest at 6.43%. The remaining three countries clustered closely between 6.51% and 6.63%. Leisure/Education features showed the greatest international variation, ranging from Turkey’s peak of 4.35% to Ireland’s minimum of 2.12%, with Sweden, Italy, and Spain occupying intermediate positions between 1.98% and 3.22%.
4. IELTS Writing Task 1 地圖變遷 (Maps)
地圖題要求您具備空間思維和描述地理變化的語言能力。成功的策略是按照地理區域或變化類型進行分組,而非隨意跳躍式描述。
位置描述詞彙:
- 方位:in the north/south, to the east/west of, adjacent to, opposite
- 變化:demolished, constructed, expanded, relocated, converted into
實用句型模板:
| 實用句型模板 | 例如 |
| The + [原建築/區域] + which was originally located + [位置描述] + was + [變化動作] + and replaced by + [新建築/區域]. | The small residential houses which were originally located in the town centre were demolished and replaced by a large commercial complex. |
| The + [區域名稱] + underwent significant transformation, with + [具體變化1] + in the + [方位], while + [具體變化2] + occurred in the + [方位]. | The waterfront area underwent significant transformation, with new recreational facilities constructed in the northern section, while residential developments occurred in the southern portion. |
| The area dedicated to + [用途] + expanded from + [原始比例/面積] + to + [新比例/面積], representing a + [倍數] + increase. | The area dedicated to industrial use expanded from 20% to 60% of the total space, representing a three-fold increase over the development period. |
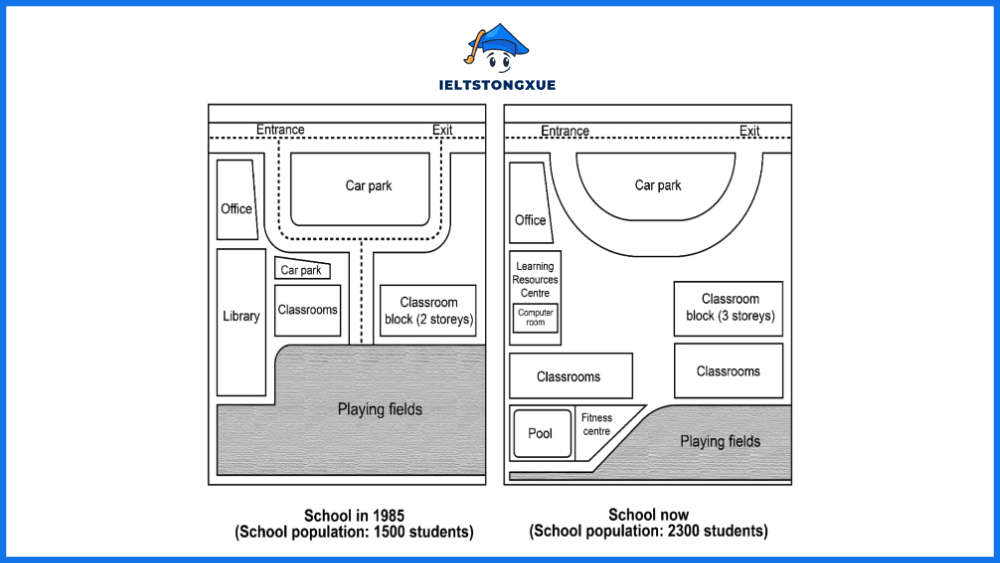
例如 IELTS Writing Task 1主題:The maps below show the changes of a school from 1985 to present time.
範例文章:
The maps illustrate the transformation of a school layout from 1985 to the present day, showing significant structural and functional changes over this period.
Overall, the school has undergone substantial expansion and modernisation, with the student population increasing from 1,500 to 2,300. The most notable changes include the addition of new facilities such as a fitness centre and learning resource centre, along with considerable modifications to existing structures.
The northern section of the school experienced dramatic transformation. The original small car park was significantly enlarged to accommodate increased staff and visitor numbers. The entrance and exit points were repositioned, with a new entrance created on the eastern side. Additionally, a modern learning resource centre was constructed in the area that previously housed part of the playing fields.
The central and southern areas also witnessed substantial modifications. The original library was converted into additional classroom space, while a new three-storey classroom block replaced the previous two-storey structure, reflecting the increased student enrollment. Perhaps most significantly, a fitness centre and swimming pool were added to the southwestern corner, utilising space that was formerly part of the playing fields. Despite these additions, adequate playing field space was preserved, though in a more compact configuration. The office area remained in its original location but appears to have been expanded to support the larger school population.
5. IELTS Writing Task 1 流程圖 (Process Diagram)
流程圖考驗您的邏輯思維和順序表達能力。關鍵是要將複雜過程分解為清晰的階段,並使用適當的順序連接詞。
順序表達詞彙:
- Initially, First, To begin with
- Subsequently, Following this, Next
- Finally, Ultimately, In the final stage
實用句型模板:
| 實用句型模板 | 例如 |
| The process commences/begins with + [第一步驟], after which + [第二步驟] + takes place. | The chocolate manufacturing process commences with cocoa bean harvesting, after which fermentation and drying take place. |
| Following + [前一步驟], the + [物質/產品] + is then + [動作] + before being + [下一動作]. | Following the initial heating phase, the mixture is then cooled to room temperature before being transferred to storage containers. |
| The entire process culminates in + [最終步驟], resulting in + [最終產品] + ready for + [用途/分銷]. | The entire process culminates in quality control testing, resulting in finished pharmaceuticals ready for distribution to healthcare facilities. |
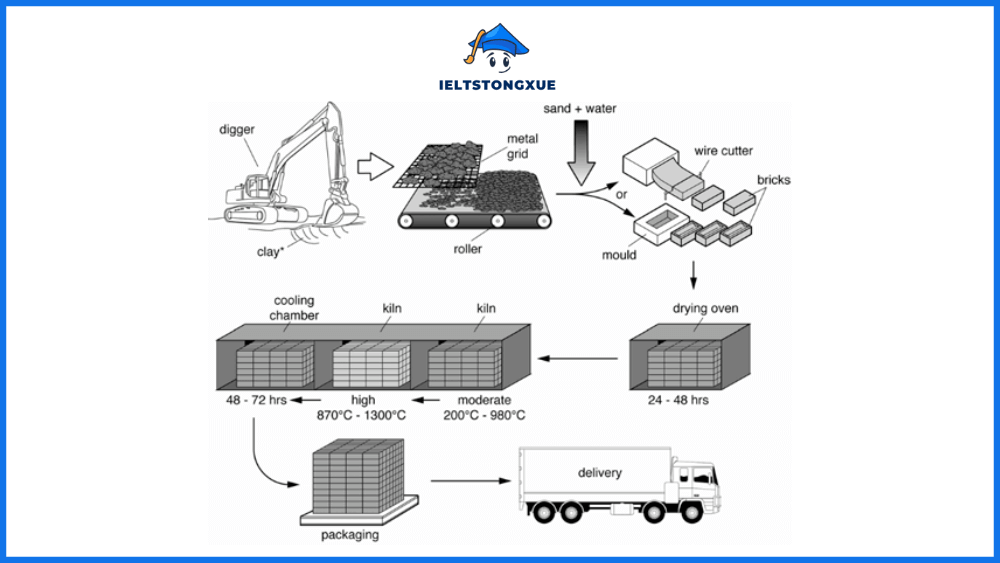
例如 IELTS Writing Task 1主題:The diagram below shows the process by which bricks are manufactured for the building industry. Summarise the information by selecting and reporting the main features, and make comparisons where relevant.
範例文章:
The diagram illustrates the manufacturing process of bricks used in the construction industry, showing the complete production cycle from raw material extraction to final delivery.
Overall, brick production involves seven distinct stages, beginning with clay extraction and culminating in packaging and distribution. The process incorporates both mechanical processing and thermal treatment, requiring temperatures ranging from moderate to extremely high levels.
The manufacturing process commences with clay extraction using a digger, after which the raw clay is transported via roller to the processing area. Subsequently, sand and water are added to the clay mixture, and the combined materials are fed into a wire cutter or moulding machine to form the initial brick shapes. This mechanical shaping represents the first critical stage in determining the final product dimensions.
Following the initial formation, the shaped bricks undergo a drying process in a specially designed chamber for 24-48 hours. Once adequately dried, the bricks enter the firing phase, which occurs in two distinct stages within kilns. The first firing takes place at moderate temperatures of 200-980°C, followed by high-temperature firing at 870-1300°C. This dual-temperature process ensures proper hardening and durability. After cooling, the finished bricks are systematically packaged and prepared for delivery to construction sites via truck transportation, completing the entire manufacturing cycle.
6. IELTS Writing Task 1 複合圖 (Multiple Graphs)
複合圖是最具挑戰性的題型,需要您同時處理多種圖表並找出它們之間的關聯。成功策略是先分別描述各圖表的主要特徵,再探討它們之間的相關性。
| 實用句型模板 | 例如 |
| The data from + [圖表一] + corresponds closely with + [圖表二], both indicating + [共同趨勢]. | The data from the employment chart corresponds closely with the economic growth figures, both indicating steady improvement throughout the recovery period. |
| While + [圖表一] + demonstrates + [趨勢一], + [圖表二] + reveals a contrasting pattern of + [趨勢二], suggesting + [可能解釋]. | While the bar chart demonstrates increasing urban population density, the line graph reveals a contrasting pattern of declining public transport usage, suggesting possible infrastructure challenges. |
| When considered together, both charts provide complementary evidence that + [綜合觀察], with + [圖表一] + showing + [證據一] + and + [圖表二] + confirming + [證據二]. | When considered together, both charts provide complementary evidence that sustainable energy adoption accelerated after 2015, with the pie chart showing renewable sources comprising 40% of total capacity and the line graph confirming a 300% increase in solar installations. |
處理複合圖時,時間分配要平衡,避免在某一圖表上花費過多篇幅而忽略其他部分。
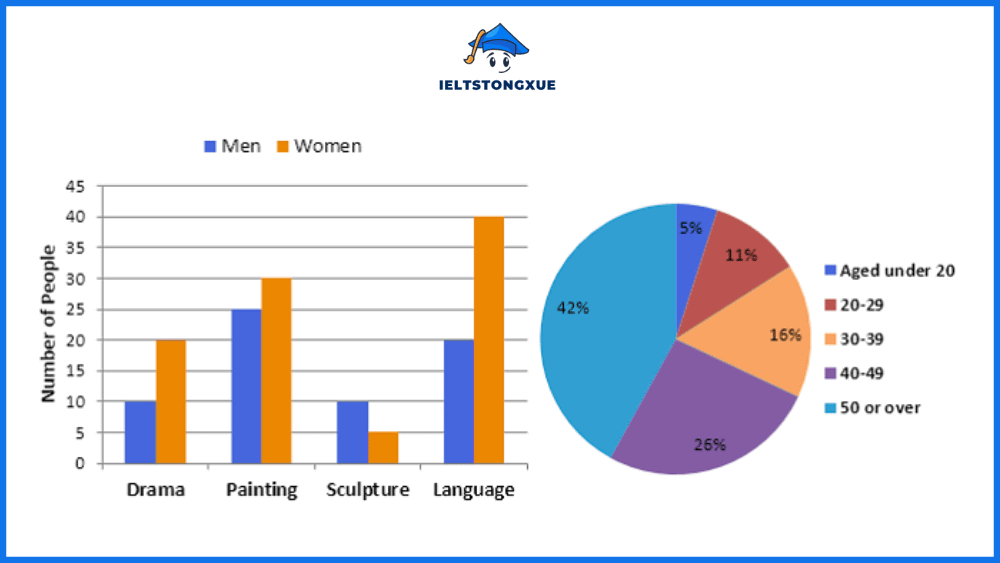
例如 IELTS Writing Task 1主題:The bar chart below shows the numbers of men and women attending various evening courses at an adult education centre in the year 2009. The pie chart gives information about the ages of these course participants. Summarise the information by selecting and reporting the main features and making comparisons where relevant.
範例文章:
The charts provide information about evening course participation at an adult education centre in 2009, with the bar chart showing attendance by gender across four subjects and the pie chart illustrating the age distribution of participants.
Overall, language courses attracted the highest enrollment, with women significantly outnumbering men across most subjects. The age analysis reveals that participants aged 50 and over constituted the largest demographic group, while those under 20 represented the smallest proportion.
Examining gender participation patterns, language courses dominated with approximately 40 female and 20 male students, representing the most popular subject area. Painting also showed strong female preference, with about 30 women compared to 10 men. Drama courses demonstrated more balanced gender distribution, with roughly 20 participants of each gender. Sculpture exhibited the lowest overall enrollment, attracting approximately 10 female students and only 5 male participants.
The age demographics revealed distinct participation patterns across different life stages. The 50-and-over group comprised the largest segment at 42% of total enrollment, suggesting strong interest in lifelong learning among older adults. The 40-49 age bracket represented 26% of participants, while the 20-29 group accounted for 16% of students. Notably, teenagers under 20 comprised merely 11% of attendees, and the 30-39 age group represented the smallest adult category at just 5%, indicating that middle-aged working adults faced greater barriers to evening course participation.
IV. 【一般訓練組實戰】IELTS Writing Task 1 三大書信語氣完全掌握
一般訓練組的成功關鍵在於準確判斷情境並運用適當的溝通語氣,這需要您具備敏銳的社交意識和文化理解。
1. 如何判斷並使用正式、半正式與非正式書信語氣?
語氣選擇直接影響您的溝通效果和考試成績。下表提供明確的判斷標準和運用指導:
| 語氣類型 | 收信對象 | 稱謂方式 | 常用片語範例 | 結尾敬語 |
| 正式 | 不認識的官方人員、公司主管 | Dear Sir/Madam | I am writing to enquire about… | Yours faithfully |
| 半正式 | 認識但不親密的人、同事 | Dear Mr./Ms. [姓氏] | I would like to inform you that… | Yours sincerely |
| 非正式 | 朋友、家人 | Dear [名字] | Hope you’re doing well! | Best wishes, Love |
在 IELTS Writing Task 1 書信題中,判斷語氣正式與否的標準主要基於關係親密度和情境正式程度。政府部門、銀行、公司投訴屬於正式情境;學校老師、房東、工作同事屬於半正式;朋友邀請、家庭聚會屬於非正式。
2. 常見書信情境演練
- 投訴信件 (Complaint Letters)
-
- 萬用片語庫:
- I am writing to express my dissatisfaction with…
- I was disappointed to discover that…
- I would appreciate it if you could resolve this matter promptly
- I look forward to your immediate response
- 高分範文精解: I am writing to express my serious concern regarding the substandard service I received at your restaurant last Friday evening, which significantly compromised what should have been a memorable celebration.
- 萬用片語庫:
- 邀請信件 (Invitation Letters) → 情境適應策略: 邀請信的語氣取決於活動性質和受邀者關係。商務會議需要正式語調,朋友聚會則可以輕鬆隨意。關鍵是要提供充足的活動資訊,包括時間、地點、著裝要求等。
- 求職信件 (Job Application Letters) → 專業表達技巧: 求職信需要平衡自信與謙遜,展現能力與熱誠。使用 “I am confident that my experience in…” 展現自信,用 “I would welcome the opportunity to discuss…” 表達積極態度。
在掌握了 IELTS Writing Task 1 的基礎結構和具體技巧後,讓我們深入探討一些容易混淆的概念和高階問題,這將幫助您建立更完整的理解體系。
V. 雅思寫作 Task 1 迷思大破解與進階問答
這個部分將解答學習過程中最常遇到的困惑,幫助您避免常見誤區並提升寫作精準度。
1. IELTS Writing Task 1 是否可以寫個人結論或推測圖表外的資訊?
不可以。IELTS Writing Task 1 要求客觀描述呈現的資訊,任何個人觀點、推測原因或提出建議都會被視為偏離主題。您的任務是成為一個中立的數據報告員,而非分析評論家。正確做法是專注於描述圖表中直接可見的趨勢、比較和特徵,使用 “The data shows…”, “According to the chart…” 等客觀表達,而避免 “This suggests that…”, “The reason might be…” 等推測性語言。
2. 何謂「主要特徵 (Key Features)」?它與「細節 (Details)」的定義有何不同?
主要特徵是指圖表中最顯著、最重要的模式和趨勢,通常包括最高最低值、整體趨勢方向、顯著變化點等。這些特徵即使不看具體數字也能明顯觀察到。細節則是支撐主要特徵的具體數據、準確數值、特定時間點等資訊。它們為主要特徵提供證據和精確度,但本身不構成分析的核心。例如,在線圖中,”銷售額持續上升” 是主要特徵,而 “從2020年的100萬增長到2023年的250萬” 是支撐細節。優秀的 IELTS Writing Task 1 作品會先確立主要特徵,再用具體細節加以支撐。
3. 哪些詞彙屬於描述「上升趨勢」,哪些屬於描述「穩定狀態」?
上升趨勢詞彙分類:
- 溫和上升:rise gradually, increase slightly, climb steadily
- 顯著上升:surge, soar, rocket, escalate dramatically
- 急劇上升:skyrocket, shoot up, spike sharply
穩定狀態詞彙分類:
- 完全穩定:remain constant, stay unchanged, maintain the same level
- 小幅波動:fluctuate around, hover around, vary slightly
- 達到平衡:level off, plateau, stabilise at
選擇詞彙時要考慮變化的程度和速度,確保描述的強度與實際數據變化相符。過度誇大或低估變化幅度都會影響準確性評分。
4. 流程圖的被動語態用法,與地圖題的被動語態用法有何異同?
兩種題型都大量使用被動語態,但側重點不同:
- 流程圖的被動語態主要描述動作和處理過程,強調步驟的順序性和連續性。例如:”The raw materials are collected, then they are processed in the factory, and finally the finished products are packaged for distribution.”
- 地圖題的被動語態主要描述建築和空間的變化,強調位置的改變和發展。例如:”The old library was demolished, and a new shopping centre was constructed in its place.”
共同點是都淡化了動作的執行者,將注意力集中在過程本身。不同點在於流程圖更注重時間順序,地圖題更注重空間關係。
總結
這份終極指南不僅為您提供了 IELTS Writing Task 1 的完整學習路徑,更重要的是幫助您建立了系統性的思考方式。從理解評分標準到掌握具體技巧,從分析圖表趨勢到撰寫恰當書信,每一個環節都是您通往高分的重要階梯。
記住,真正的精通來自於將這些策略內化為自己的寫作習慣。不要滿足於機械性地套用模板,而要學會靈活運用所學知識,根據不同題型和情境調整您的表達方式。當您能夠自如地在客觀描述與生動表達之間找到平衡,在準確性與豐富性之間取得協調時,高分自然水到渠成。
持續練習、反思改進、精益求精——這是從學習走向掌握的不二法門。願這份指南成為您雅思寫作路上的明燈,照亮通往成功的每一步道路。